Outcome Measure Insights
The new Insights tab in the client's chart is designed to enhance data-driven decision-making and support more personalized care! This powerful feature provides a clear, visual overview of a patient's outcome measure scores over time and makes it simple to track progress.
Key Features:
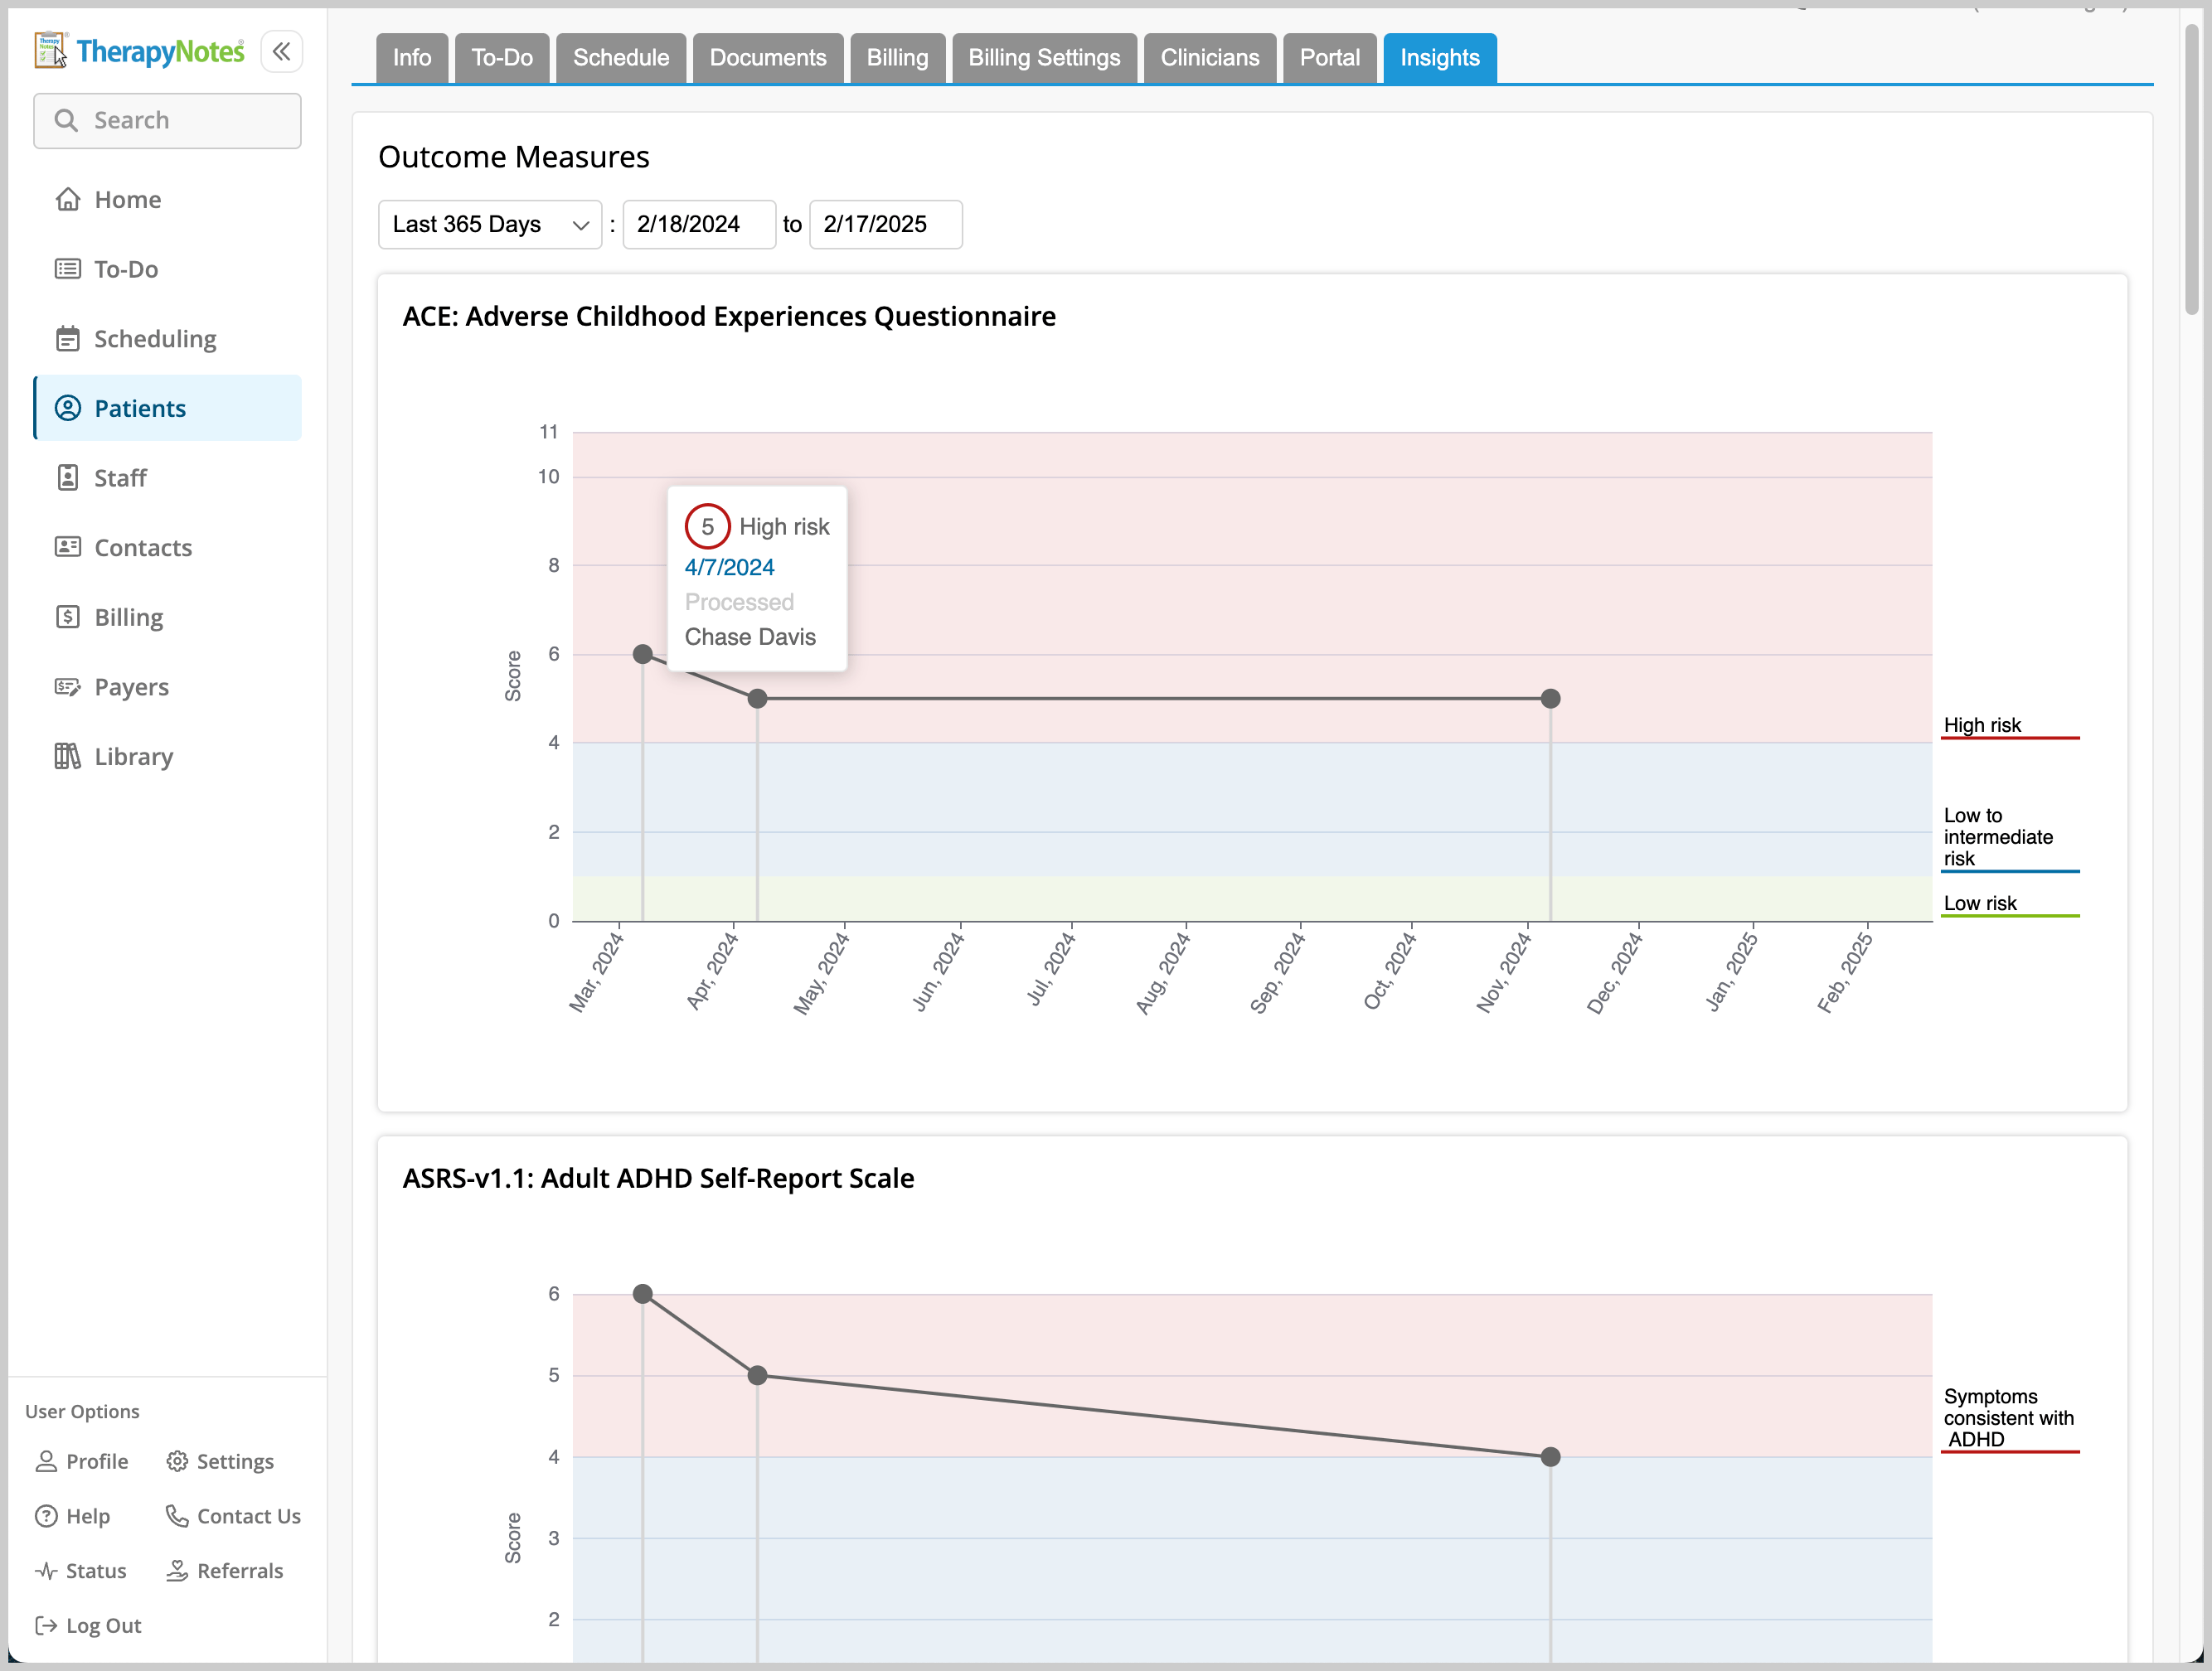
- Powerful Trend Graphs: At a glance, see trends of scores for a client's completed measures displayed over time. Outcome measures with score ranges are color-coded for quick visual interpretation.
- Real-Time Score History: Once a client completes supported outcome measures, their score history will appear automatically in the Insights tab.
- Interactive Visuals: Hover over any score on the graph to view additional submission details and click the completion date to access the full results.
- Customizable Filters: Adjust date ranges to track trends and identify important patterns in client outcomes.